Just want the code?
Toward RestWell, if you followed along with the previous post in this series you’ll now have a completely useless plot in the Angular initial website. Let’s improve that! In this post we’ll make two changes. We’ll first create an Angular component for our plot then we will create an Angular service for our data.
We want a more RESTful experience for our plot. By default the angular-plotly component takes in the data and layout inputs. This means that for each plot we create we have to find the data, format the data and then pass it into the component. Given that the data should be located at some universal resource identifier (which I consider a URL plus parameters) and that the data’s format should be well specified, we can automate this. That is we should be able to pass in a URL and a few parameters and the plot component should be fully capable of finding, formatting, and rendering the data.
The first step in our journey is to create a plot component. Navigate to src/app/ and run the Angular CLI command ng g c mr-plot. This will generate a new Angular component called ‘mr-plot’. Inside the src/app/ folder there will be a new folder ‘mr-plot’, the same name as the component.
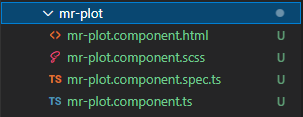
Inside the src/app/mr-plot/ folder will be four files. Three of these files define everything about the component. There is the .html file that is written in Angular’s HTML templeting language, there is the .scss file for the components styling and there is the .ts file for the TypeScript functionality of the component. I’m not going to yammer on about the use of these files (read the docs). If you are at all familiar with coding on the web, these should be understandable. We’re just going to dive right in and learn by doing.
Following along with our design principle of small changes. We’re going to begin using the mr-plot component in it’s default form. Open up the src/app/app.component.html file and delete all the contents. It’s all the default new Angular project junk, you don’t need any of it. Then add <app-mr-plot></app-mr-plot>. You should see the following:
Where did this HTML tag <app-mr-plot> come from? It’s defined in the TypeScript file src/app/app.component.ts. In that file you will see the @Component decorator. This decorator defines the selector attribute which is the HTML tag. You can change this to what ever you want. However it’s generally frowned upon and some linters will complain. I live in trembling fear of the linter’s squiggly disapproval so, we’ll use the default.
@Component({
  selector: 'app-mr-plot',
  templateUrl: './mr-plot.component.html',
  styleUrls: ['./mr-plot.component.scss']
})
The @Component decorator is also where the Angular component defines the template and styling. In our my-plot component it is pointing to a template file (mr-plot.component.html) and a style file (mr-plot.component.scss). It is possible to not use files and just write the template and styling code right there in the @Component decorator with the template and styles attributes. Don’t do that! I only mention this because, sometimes you will see a component use these. You’ll be wondering where the HTML template file is for some component only to realize they didn’t use one. Follow convention and create individual files.
Now we have the mr-plot component working, we need to get it plotting. We’re going to recreate the angular-plotly plot from the previous post. Add the following to the src/app/mr-plot/mr-plot.component.ts file.
const lineTrace = {
  type: 'scatter',
  mode: 'lines',
  x: [1, 2, 3],
  y: [2, 6, 3],
  line: {
    color: 'red',
  },
};

const barTrace = {
  type: 'bar',
  x: [1, 2, 3],
  y: [2, 5, 3],
};

const layout = {
  width: 320,
  height: 240,
  title: 'A Fancy Plot'
};
Then add the following to the mr-plot class in src/app/mr-plot/mr-plot.component.ts.
  graph: {data: Object[], layout: Object} = {
    data: [lineTrace, barTrace],
    layout: layout,
  };
Then replace the code in src/app/mr-plot/mr-plot.component.html with <plotly-plot [data]="graph.data" [layout]="graph.layout"></plotly-plot>. If you are following along from the previous post, we’ve just shuffled some code around. Moving it from src/app/app.component.html and src/app/app.comonent.ts to our mr-plot component. And now we have the same basic plot from the previous post. However, it is now contained within it’s own component.

And now that we have got our mr-plot component we have to ask ourselves why were we creating it in the first place? That’s right, it was supposed to find, format and render our data automatically. This going to take a little bit of planning and fore-thought. Our data is on some server somewhere in the backend. We can access it through a URI (URL + parameters). The data will come to us in some format (check the spec) and we have to transform it into a PlotlyJS trace.

This gives us the data flow shown in the diagram above. We can see the data on the left with the data server. There is the server’s API that we would connect to through Angular’s built in HTTP service (nice) and then there is the data service which will use the HTTP service to get the data and it will also transform the data ready to be passed down to the webpage and the mr-plot component.
Everything in the dashed box, we’re just going to pretend it exists. It’s too much work right now, we’re trying to take incremental steps towards our goal. In fact we’ve already made some pretty good progress. We have a website up and running (not very filled in) and we have a plot component configured and plotting (without good data). Our next incremental step is right next to those two in the diagram: the data service.
We can create a service with the CLI command ng g s plot-data. Notice it is g s for ‘generate service’ not g c for ‘generate component’. This command won’t create a new folder instead it creates files. The important one is called plot-data.service.ts and the other one is for testing, ignore it for now.
Open the plot-data.service.ts file and move the lineTrace, barTrace and layout objects to it. To pass the data from the data service back to the mr-plot component we’re going to create a function data() on the service. But first we should think about how we are going to pass the data back. That is what should the return type of the data() function. The library angular-plotly has been using this graph object with the keys data and layout. This seems like a good way to go, so we will return that object. Add the following code into the plot-data service class.
  data(): any {
    const graph = {
       data: [lineTrace, barTrace],
       layout: layout,
    };
    return JSON.parse(JSON.stringify(graph));
  }
Most of that should be straight-forward, but there is that JSON bit. The code JSON.parse(JSON.stringify(graph)) is a simple way to do a deep copy of the graph object. We want a deep copy so that the each component we provide data to has indepedent state. The last thing we would want is for one component to modify it’s graph object (accidentally of course) and cause effects for a completely different component. Debug that!
Our plot-data service now has data we still need to get our mr-plot component to access it. The first thing we do is tell Angular to inject the service for our mr-plot component. This will allow mr-plot to access all the public functions and variables of the plot-data service’s class. We tell Angular to inject the service by changing the mr-plot component’s constructor. Currently the constructor is empty, change it to:
  constructor(
    protected plot_data: PlotDataService,
  ) { }
Now we can access the data() function in the my-plot class by calling this.plot_data.data(). Something to keep in mind is that there is only one instance of the plot-data service. If we have multiple my-plot components strewn throughout our website, each plot component will be accessing the same plot-data service and calling the same data() function.
Let’s modify the mr-plot component to pull data from the plot-data service. Create a loadData() function to pull the data from the service and fill in the graph data. It should look like:
  loadData(): void {
    this.graph = this.plot_data.data();
  }
As it is this function won’t be called. Feel free to check, but you know I’m right. We can call the loadData() function inside the mr-plot constructor. The plot-data service will be injected and then the loadData() function will be called and the graph loaded and everything will render correctly. However, this isn’t the best Angular programming practice. There have been times where I was forced to put code into a component’s constructor, but I prefer to use Angular’s life-cycle hooks.
Angular provides a ton of life cycle hooks but you mostly only need two: ngOnInit() and ngOnChanges(). They are what they seem to be. The hook ngOnInit() is called once at the beginning of the component’s life-cycle and ngOnChanges() is called every time one of the component’s inputs change. The main difference between ngOnInit() and the constructor is that the component’s inputs will be valid for ngOnInit() but won’t be valid for the constructor because the Angular framework hasn’t passed them in yet. Yadda Yadda Yadda what do you do? Call the loadData() function inside the ngOnInit() function.
The plot should be working great. However, I don’t know about you, but sometimes when I’m copying and pasteing data around I don’t always trust it when I’m always seeing the same thing. Let’s change the data in the plot-data service so we know thats the source of the plot data. I’m going to just copy the last data point for both the line trace and the bar trace. You should end up with the following.

If you have a better memory than me you’ll recall that we were doing all this work in order to pass a url and parameters into the mr-plot component and have the component pull the data. So we should create some inputs for the mr-plot component. One for the url and one for the parameters. The mr-plot component should pass those values up to the plot-data service.
We can create inputs for the mr-plot component by using the @Input() variable decorator inside the mr-plot class. The following code creates a url input and a parameters input. I’ve also added the code to pass these inputs up to the plot-data service.
@Component({
  selector: 'app-mr-plot',
  templateUrl: './mr-plot.component.html',
  styleUrls: ['./mr-plot.component.scss']
})
export class MrPlotComponent implements OnInit {

  @Input() url: string = '';
  @Input() parameters: {[key: string]: string} = {};

  graph: {data: Object[], layout: Object} = {
    data: [],
    layout: {},
  };

  constructor(
    protected plot_data: PlotDataService,
  ) { }

  ngOnInit(): void {
    this.loadData();
  }

  loadData(): void {
    this.graph = this.plot_data.data(this.url, this.parameters);
  }
We should also update the plot-data.data() function to receive these parameters. If you just copy over the mr-plot code you’ll be encountering errors. Since we can’t really do anything with these inputs right now we are going to just print them to console. The modified data() code should look like the following.
data(url: string, parameters: {[key: string]: string}): any {
    console.log({url, parameters})
    const graph = {
       data: [lineTrace, barTrace],
       layout: layout,
    };
    return JSON.parse(JSON.stringify(graph));
  }
If you open up the DevTool’s console you should see the default input values being printed to the console.

We can now check the whole mr-plot component input flow by providing inputs to the mr-plot component. We’ve already seen how to do this with angular-plotly’s plotly-plot component. Inside the /src/app/app.component.html template we add the code: [url]="'www.server.com/data/'" [parameters]="{datetime_start: '2022-01-01', datetime_end: '2022-01-02'}" inside the <app-mr-plot> tag. It should look like the following.
<app-mr-plot [url]="'www.server.com/data/'" [parameters]="{datetime_start: '2022-01-01', datetime_end: '2022-01-02'}"></app-mr-plot>Notice how the content inside the double-quotes (“) is treated as TypeScript. Our url is a string so we have to surround it with single-quotes (‘) otherwise Angular doesn’t know what it is. Make sure your write your code accordingly. However, this is not a full featured TypeScript environment. For example, you can’t use the code new Date('2022-01-01').toISOString(). It’ll throw an error. Reading the error you’ll see that Angular assumes that new refers to a variable on the component’s class. Consider yourself warned. If you really wanted to do this, assign the value to a variable on the class and then pass in that variable. The modification will look like the following.
import { Component } from '@angular/core';

@Component({
  selector: 'app-root',
  templateUrl: './app.component.html',
  styleUrls: ['./app.component.scss']
})
export class AppComponent {
  title = 'towards-rest';
  datetime_start = new Date('2022-01-01').toISOString();
  datetime_end = new Date('2022-01-02').toISOString();
}
<app-mr-plot [url]="'www.server.com/data/'" [parameters]="{datetime_start, datetime_end}"></app-mr-plot>I know, I know, we were supposed to have a plot that did something interesting, but we just got bogged down with all the other stuff. Welcome to programming. However, we’ve begun a pretty good structure for our plotting components. It’s not complete, but it is a good start. In future installments of this series we’ll continue to build on this We’re going to explore the joys of the RxJs library and we’ll also mock up a backend for development purposes.