Just want the code?
The BeginningI love PlotlyJS. Let’s see how to set it up with Angular. We will be using angular-plotly.js (npm) to incorporate the PlotlyJS library into the Angular framework. If you’re unfamiliar with Angular checkout their website. There is a lot of useful information about Angular and how to set it up and get familiar with it. Make sure you have Node.js installed and can use the npm and the ng commands. You can verify this by simply running npm --help and ng --help.
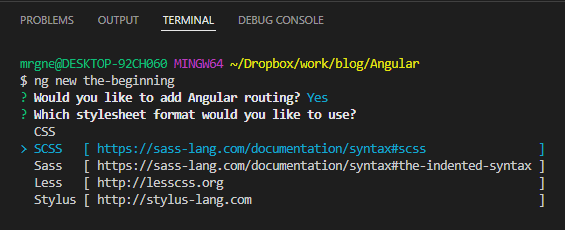
Let create our new Angular project. I will name it ‘the-beginning’, but you can name it whatever you feel will be a good name. Run the command ng new the-beginning. You will be asked two questions: Would you like to add Angular routing? Which stylesheet format would you like to use?. The details of what these questions are asking is a little beyond what I’ll discuss today. For my project I selected Yes use Angular routing and the SCSS stylesheet format.
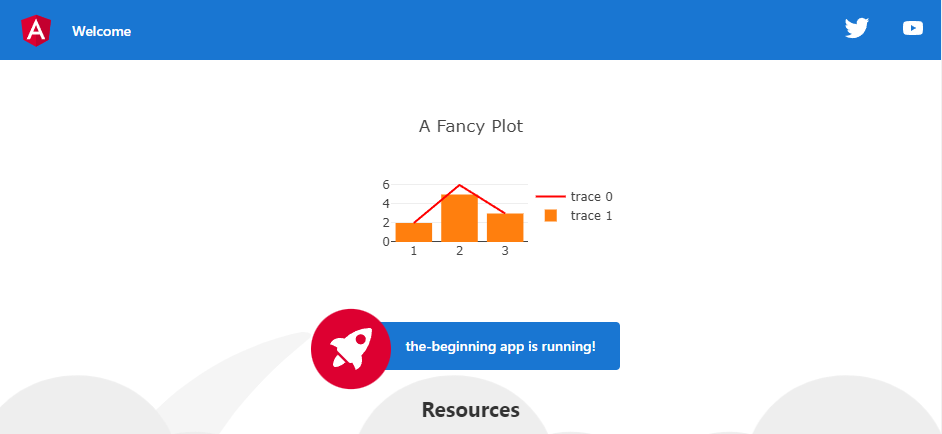
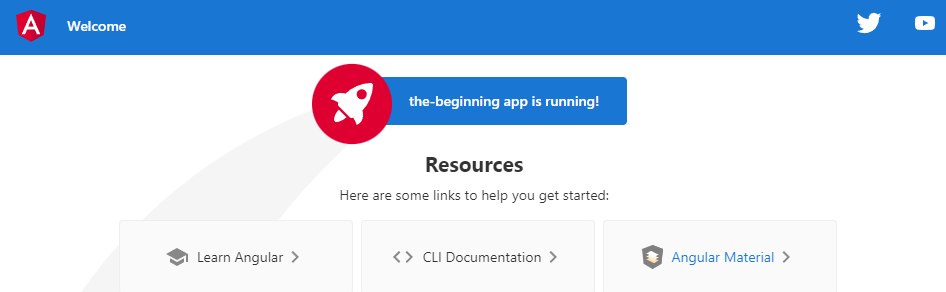
Now that our Angular project has been created we should change directories to it with cd the-beginning so that we can begin to edit it. Before making any changes we should verify that the website even runs. Remember test, test, test, test, test. Type ng serve and the Angular CLI will generate the website. The CLI will also host the website on Angular’s built-in development server. Visit the website by navigating to http://localhost:4200 in your browser.
With the site up and running we can begin to do some actual work. We start with the installation of angular-plotly and PlotlyJS. We are going to just be following along with the installation instructions from angular-plotly so if these instructions don’t work you should check to see if they have changed. We are going to use two commands for the installation. First we are going to install the angular-plotly library and the minimum version of PlotlyJS with the command npm install angular-plotly.js plotly.js-dist-min --save. Next we can install the types for PlotlyJS with the command npm install @types/plotly.js-dist-min --save-dev.
We aren’t done setting up our environment for angular-plotly. We need to open the app.module file, this should be located in the-beginning/src/app/app.module. In this file we are going to import PlotlyJS’s code base as a single file. We are also going to import angular-plotly’s PlotlyModule and attach the PlotlyJS’s code base to it. This proceedure is required so that we can pick the PlotlyJS code that we want to include. It is possible to use CDN’s or to include only minimal compilations of PlotlyJS’s code. Because of this attachement we can reduce or increase the size of our code to fit our needs. I’ve included the entire app.module code below and commented the 4 lines of code that need to be changed.
import { NgModule } from '@angular/core';
import { BrowserModule } from '@angular/platform-browser';

import { AppRoutingModule } from './app-routing.module';
import { AppComponent } from './app.component';

import * as PlotlyJS from 'plotly.js-dist-min'; // add this line
import { PlotlyModule } from 'angular-plotly.js'; // add this line

PlotlyModule.plotlyjs = PlotlyJS; // add this line

@NgModule({
  declarations: [
    AppComponent
  ],
  imports: [
    BrowserModule,
    AppRoutingModule,
    PlotlyModule, // add this line
  ],
  providers: [],
  bootstrap: [AppComponent]
})
export class AppModule { }
Okay, app.module has been changed. Now is a good time to recheck if everything is correct, that the code will compile and the website will be served. For carpenters the phrase is “measure twice cut once,” for programmers the phrase is “test, test, test, test, test.” Our little ng serve check may not be as formal as a unit test, but it is extemely useful for debugging purposes. If an error occurs we know it must have happened between the last time we ran ng serve and now. We have limited the scope of our investigation to whatever was changed between our last good run and our first bad run. Reducing the amount of time or code changes between those two points in time means we have less to investigate. Hopefully that will reduce the amount of time debugging.
It may not seem like we have done all that much since we checked the initial Angular project run. All that we did was install angular-plotly and configure it for our project. But I am writing this for a specific reason: I literally encountered an error in those two steps. My error was typing npm install angular-plotly plotly.js-dist-min instead of npm install angular-plotly.js plotly.js-dist-min. Can’t see the difference? Look hard and test, test, test, test, test.
Anyway, my typing skills aside, we can move on. Let’s Plot!
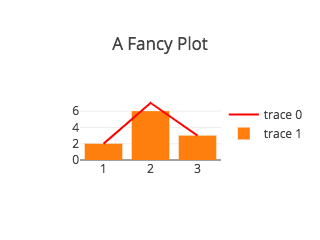
Wait, wait, wait, before we create our plot, this is a good time to discuss some of the terminology that PlotlyJS uses. Our plot is going to have a line chart (shown in red) and a bar chart (shown in orange). PlotlyJS considers these three things as seperate elements. There is the plot on which the lines and bars will be drawn. The plot defines the size of the canvas: width and height, it also holds the title and the legend. Then there are traces, for PlotlyJS both the line chart and the bar chart are traces. This creates a composable system of plot elements. Our simple little graph above can be created by using one bar trace and one line trace and adding them to the same plot. Additionally any of the other traces that plotly defines can be combined together to display exactly the information that you want.
Each of the traces contains all the information needed to render the trace on the plot. For the line in our graph, we will need the x-positions and the y-positions of points along the line. We can also define the styling of the trace (color, line-width, line-style etc). The available styling will vary with the type of trace so when you use a new trace type you should check to see what styling is available for that type. The form that a trace takes in the code is a JavaScript/TypeScript Object. For the line in our plot above we can create the following.
const lineTrace = {
  type: 'scatter',
  mode: 'lines',
  x: [1, 2, 3],
  y: [2, 6, 3],
  line: {
    color: 'red',
  },
};
The first thing to notice is the type, it is ‘scatter’. In PlotlyJS this type is overloaded: it can be used to plot points, or a lines or lines with points. We define which of these overloaded traces we want to use with the ‘mode’ attribute. Here we have specified the mode ‘lines’ for a line plot. If we wanted scatter points we could have used ‘points’. If we wanted both we could use the syntax ‘lines+points’. It is also possible to use the scatter trace as a text charts and bubble charts (read the docs).
The second thing to notice is the x-positions and y-positions are given as two seperate arrays. Those two arrays match with the xy-points (1, 2), (2, 6), (3, 3). It’s pretty simple once you get it.
Lastly, we can see the styling of the line. We have used the attribute ‘line’ to create a new object with the key-value pair of ‘color’ and ‘red’. This will, of course, render the a red line. PlotlyJS will accept any of the standard CSS color definitions. So instead of ‘red’ we could have used ‘rgb(255, 0, 0)’ or ‘#ff0000’ or ‘hsl(0, 100%, 50%)’ or ‘hsv(0, 100%, 100%)’.
The following Object defines the trace for the bar chart shown above. It’s very similar to the lineTrace shown above. The main difference is this trace has the type of 'bar'.
const barTrace = {
  type: 'bar',
  x: [1, 2, 3],
  y: [2, 5, 3],
};
Now that we can create traces, we still need to learn about the PlotlyJS plot element. Modifying the plot element is done through the plot’s layout. For our plot above we can use a relatively simple layout. It’s pretty obvious what each key-value pair means, so I’ll restrain myself from explanation.
const layout = {
  width: 320,
  height: 240,
  title: 'A Fancy Plot'
};
Okay, finally, Let’s Plot!
Open up the src/app/app.component.ts file in your project. Place the lineTrace, barTrace and layout objects from above into the file. Place them after the imports but before the @Component statement. This will make them global variables, but don’t worry too much about that we will eventually move them. Right now we just want to get the plotting up and running.
Inside the app.component.ts file there is the class AppComponent. We are going to add the trace and the layout objects to the AppComponent class. To do this we are gonna follow the angular-plotly convention of creating a graph object. The app.component.ts file should look like the following.
import { Component } from '@angular/core';

const lineTrace = {
  type: 'scatter',
  mode: 'lines',
  x: [1, 2, 3],
  y: [2, 6, 3],
  line: {
    color: 'red',
  },
};

const barTrace = {
  type: 'bar',
  x: [1, 2, 3],
  y: [2, 5, 3],
};

const layout = {
  width: 320,
  height: 240,
  title: 'A Fancy Plot'
};

@Component({
  selector: 'app-root',
  templateUrl: './app.component.html',
  styleUrls: ['./app.component.scss']
})
export class AppComponent {
  title = 'the-beginning';
  graph: {data: Object[], layout: Object} = {
    data: [lineTrace, barTrace],
    layout: layout,
  };
}
Now open the app template file src/app/app.component.html and insert the following code.
<plotly-plot [data]="graph.data" [layout]="graph.layout"></plotly-plot>This statement instantiates the plotly-plot component from the angular-plotly library. This component has two inputs. One input is called ‘data’ and is a list of traces. The other input is called ‘layout’ and is the layout object. We pass data to these inputs through the Angular binding syntax [data]="graph.data". This connects the data input of the plotly-plot component to the graph.data variable that we created in the AppComponent. With the app component updated, check the website and see that beautiful plotly plot.